Ichimoku Clouds Explained
ICHIMOKU Kynko Hyo is a method of technical analysis developed by Goichi Hosoda (which Ichimoku Sanjin used as a pseudonym, that is, what the man on the mountain observes) in the 50s.
In fact, the name derives precisely from the need for this journalist to obtain graphic information at one time. His work began in 1940, and he developed it after the Second World War, using tens of thousands of hours of students to perform calculations and optimizations in the era prior to personal computers.
The analysis environment consists of a candlestick chart and five additional lines:
Kumo : two lines formed by moving averages moved forward.Kijun and Tenkan : Two moving averages.Chikou : The closing line moved backwards.
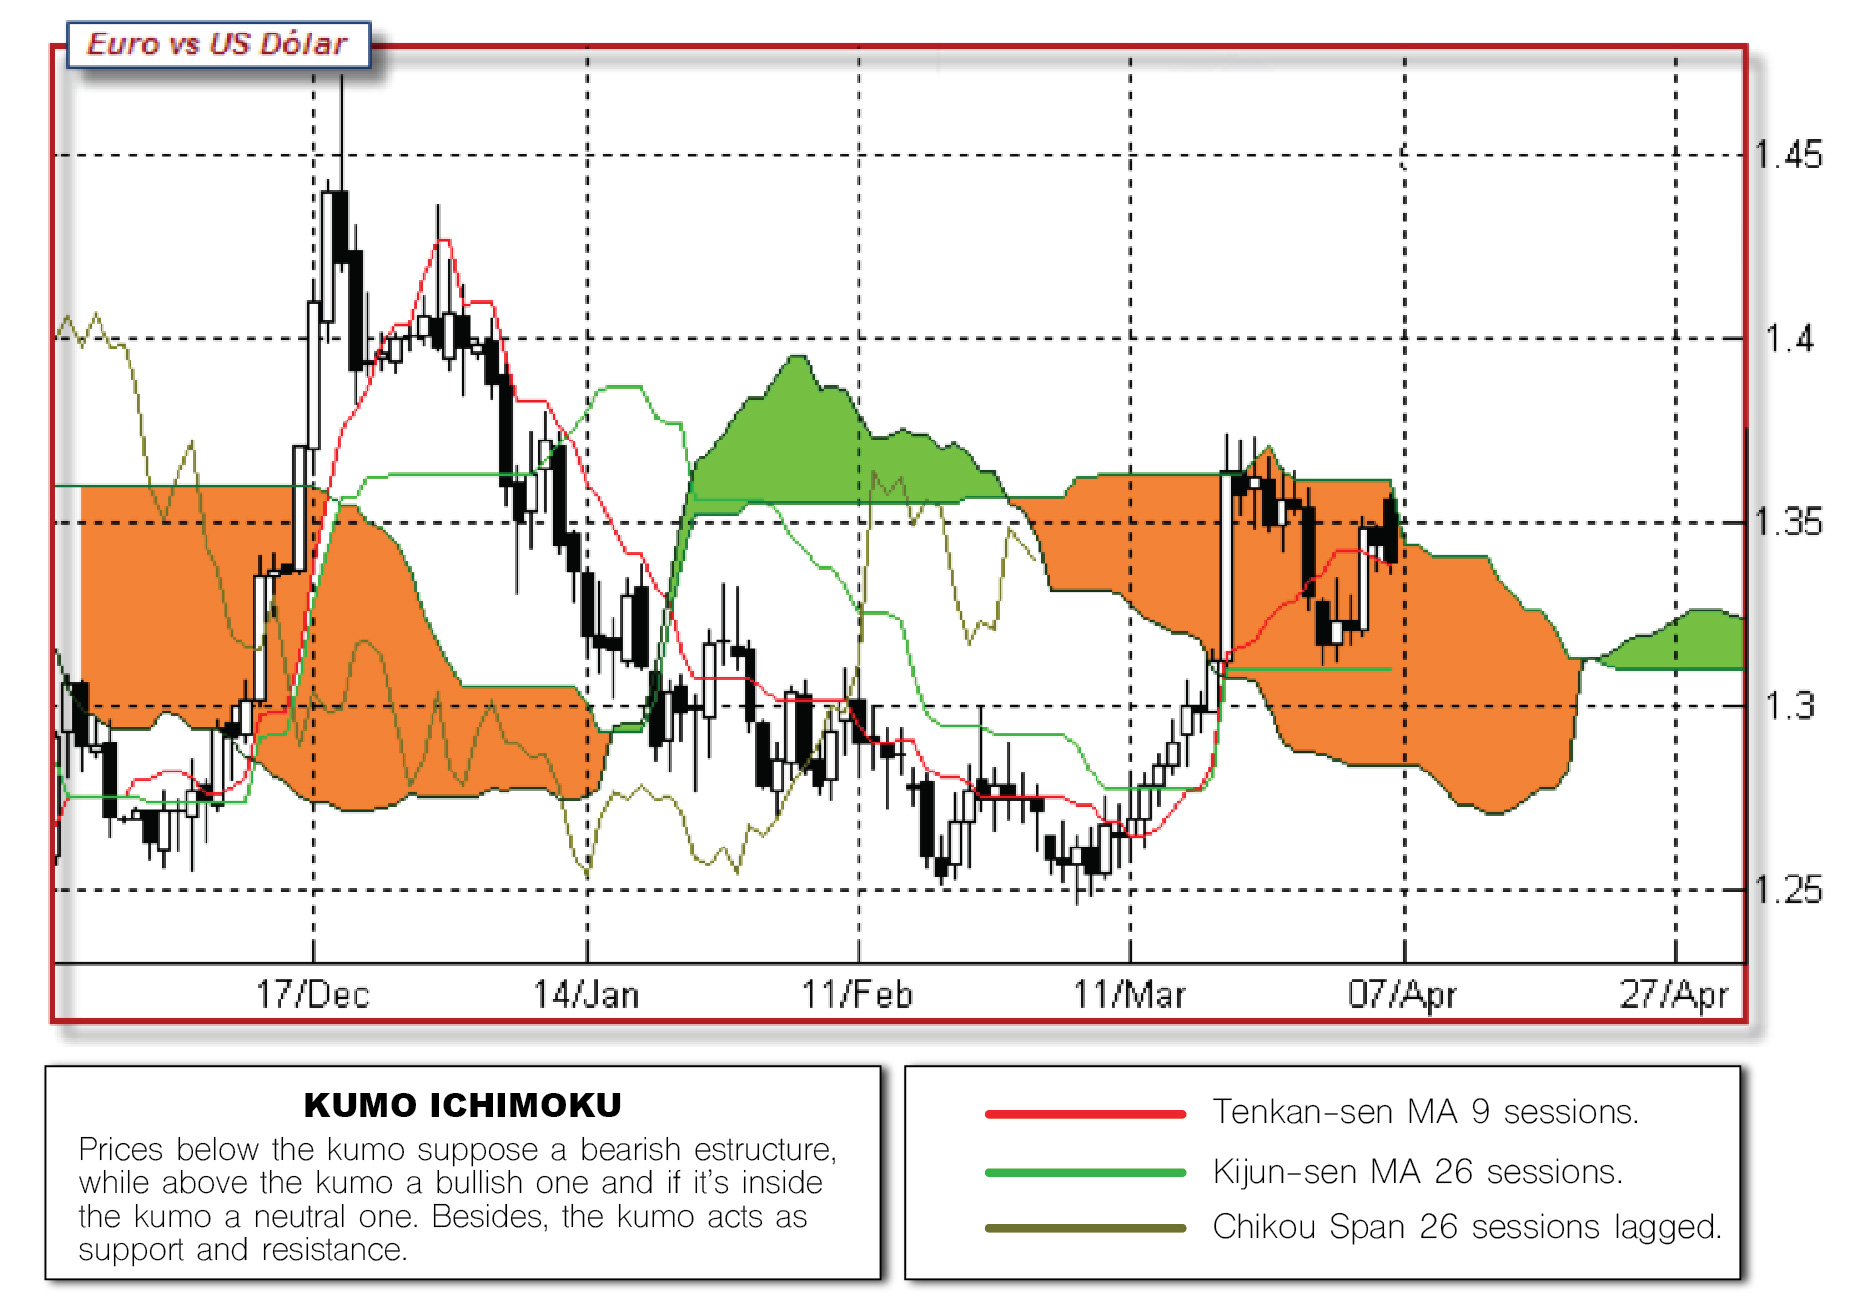
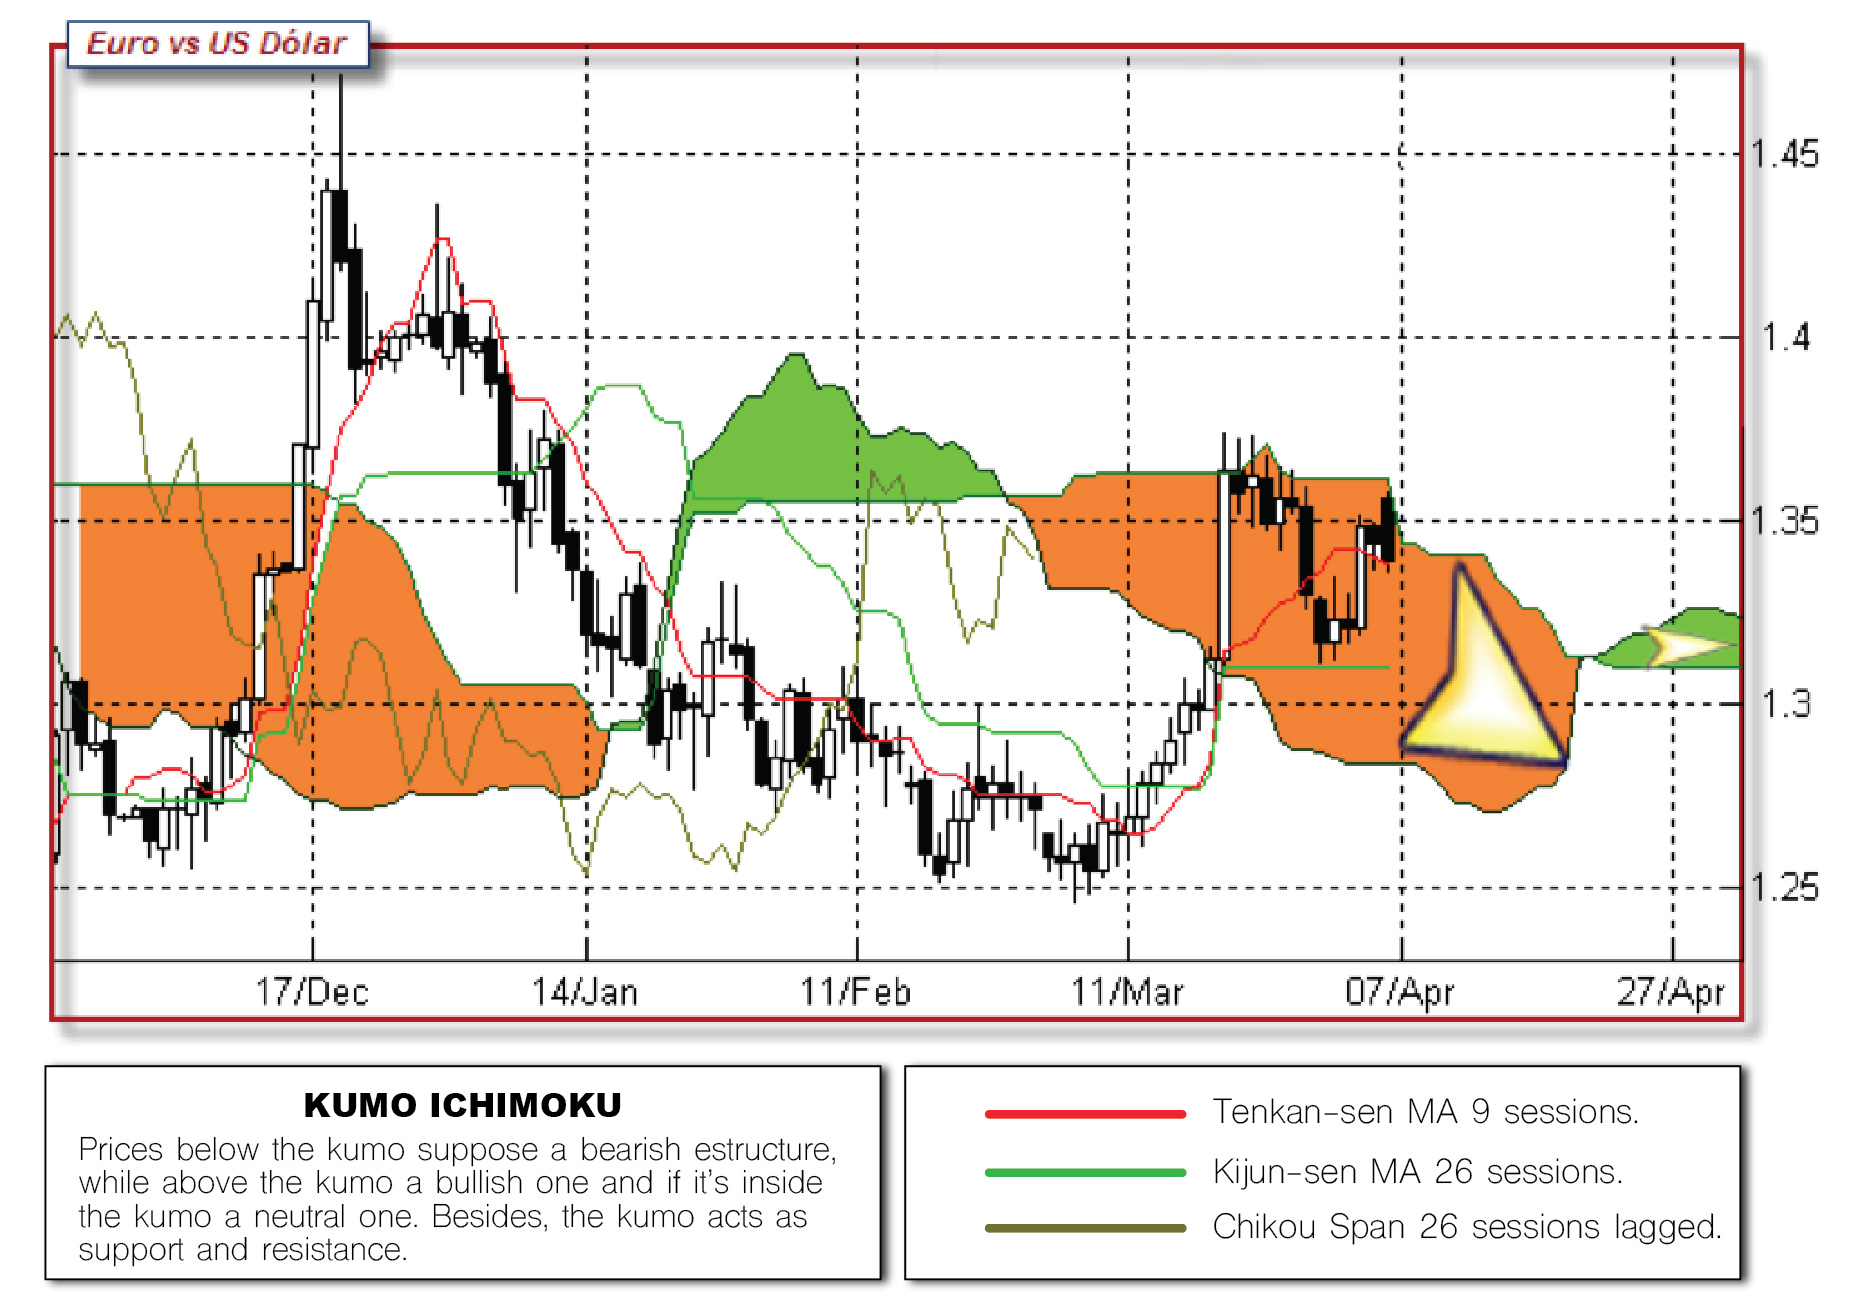
Ichimoku-Initial Chart
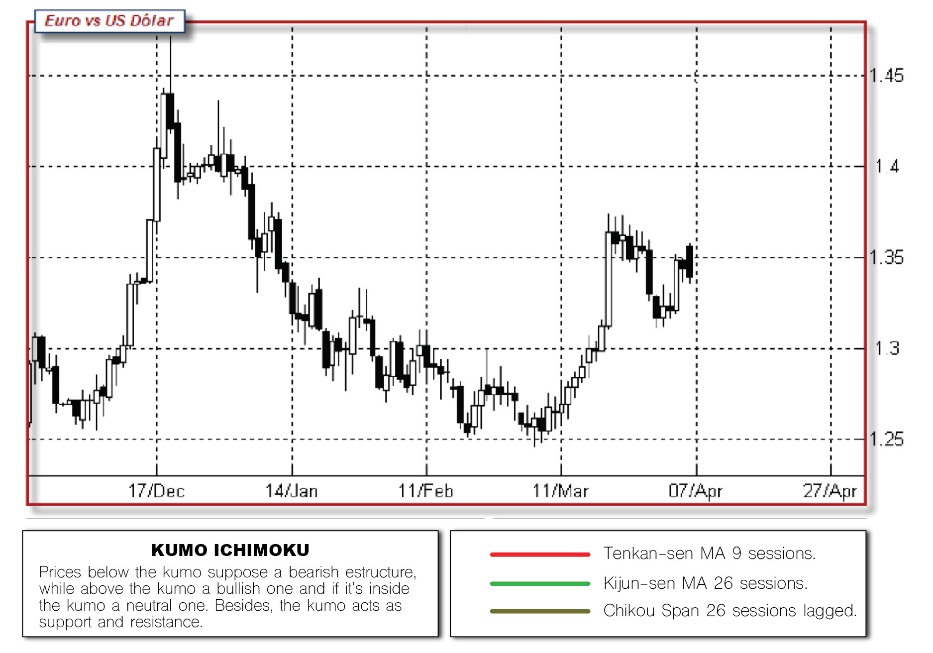
The
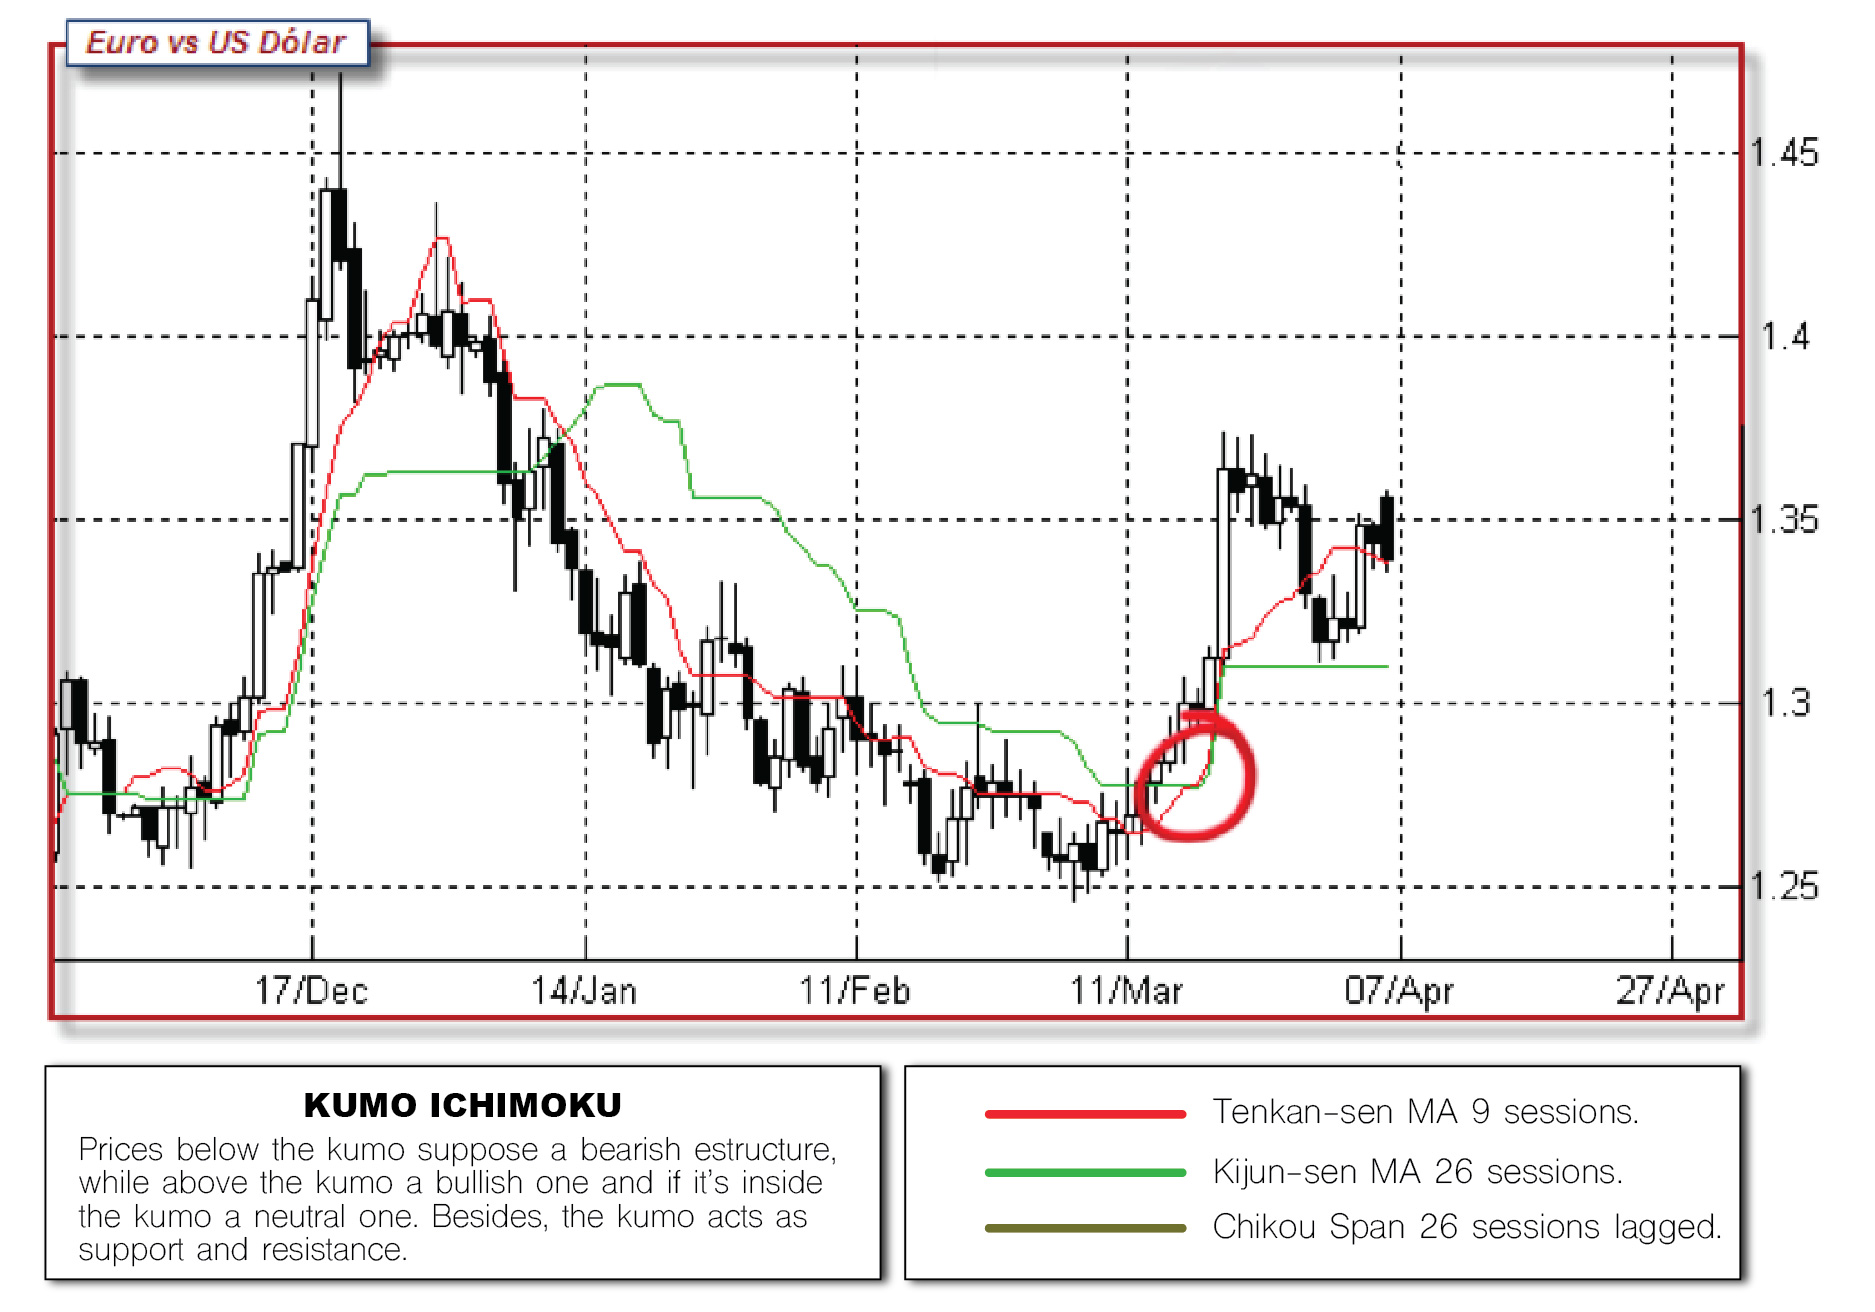
Moving average -Tenkan sen MM9
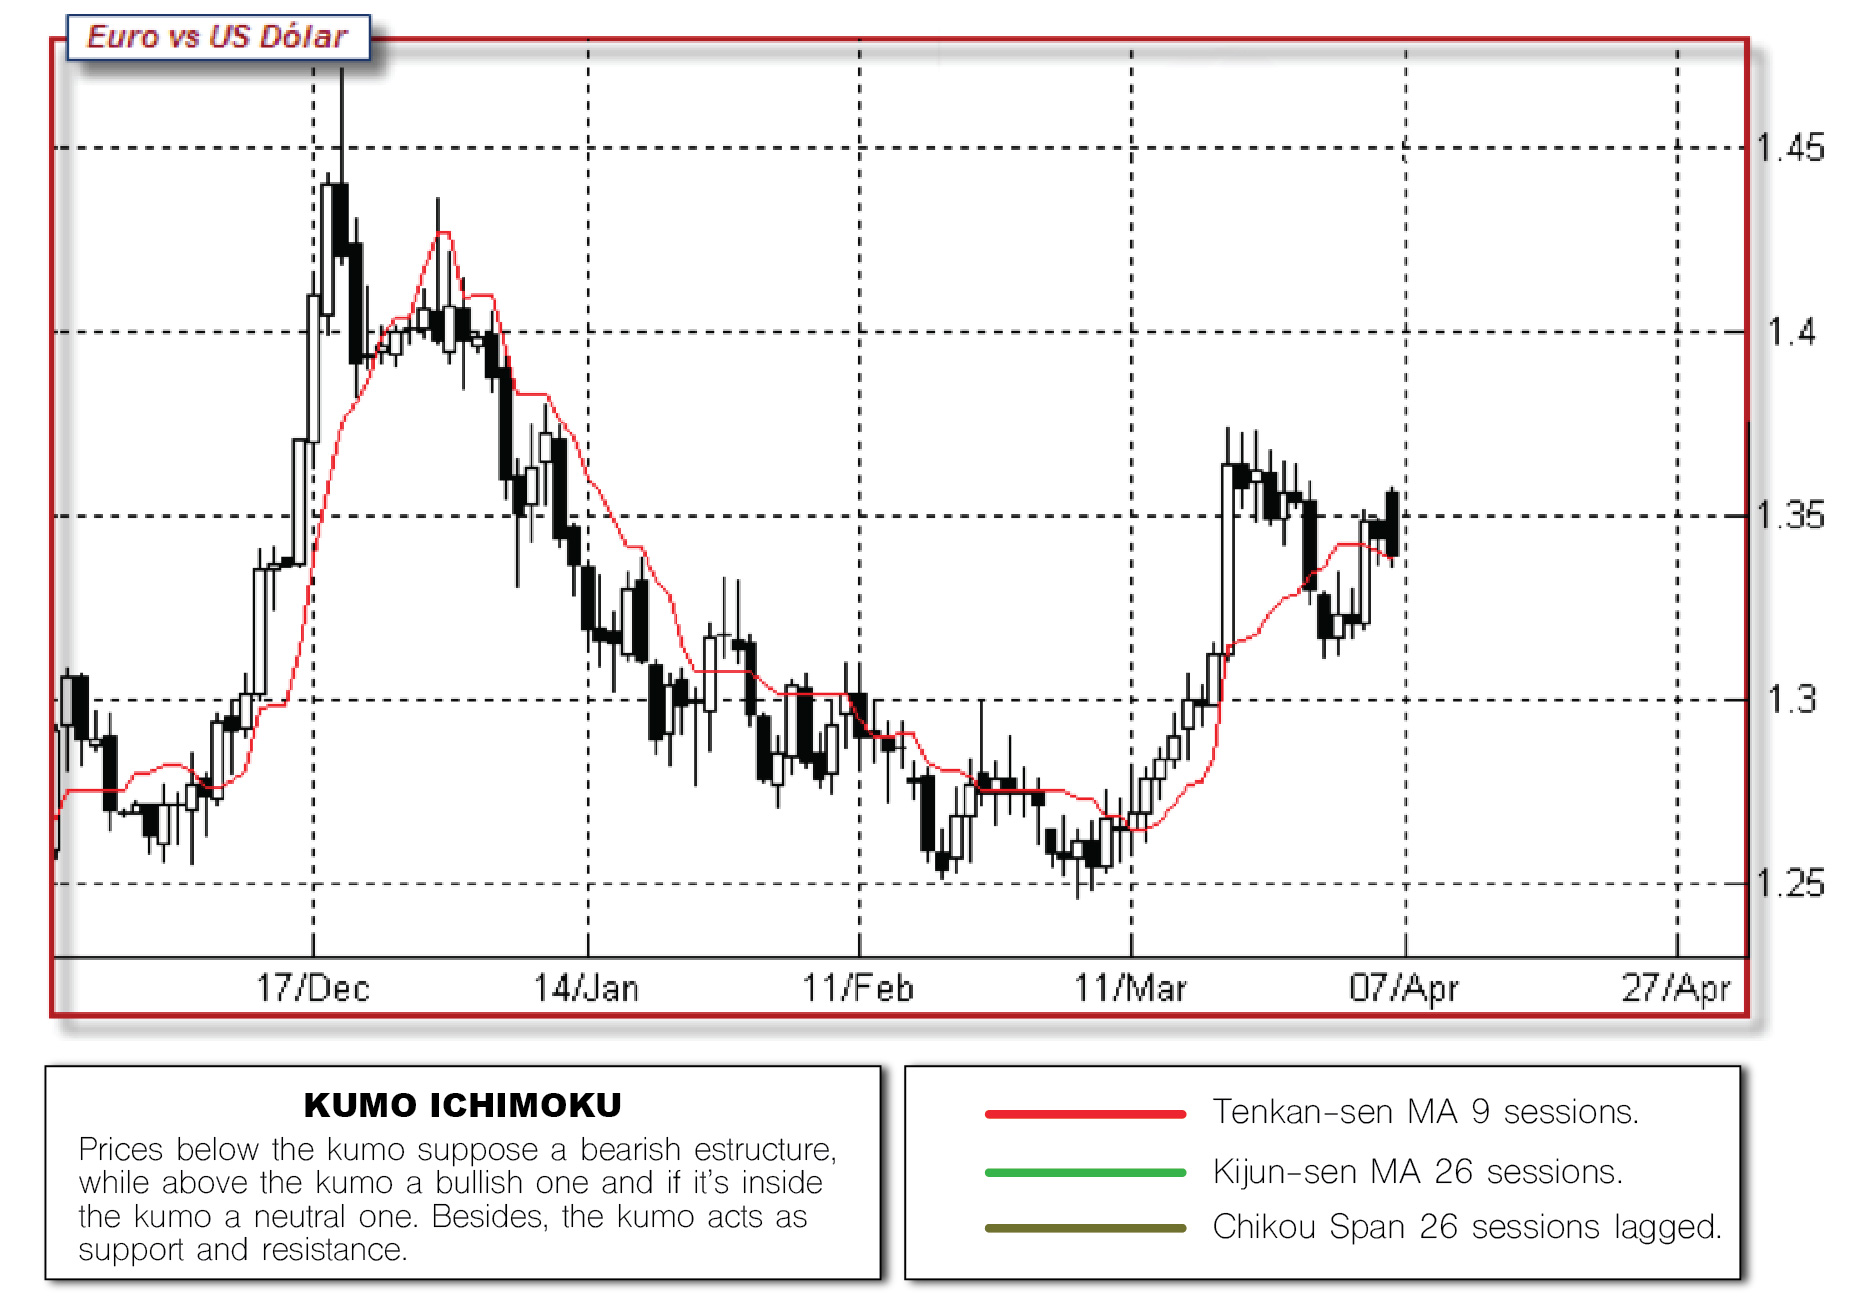
CALCULATION
(9 days’ high + 9 days’ low)/2TREND
The short term trend is in the direction that the TS 9 is pointing. The steeper the angle, the deeper the trend.
SENTIMENT
If Price > TS Bullish short term bias
If Price < TS Bearish short term bias
POSIBLE SIGNALS
A change signal may be considered If the price crosses the TS in the opposite way than the trend. Watch out for a possible cross of the Kijun Sen:
- Soft Change: When the Kijun Sen is not crossed
- Medium Change: If the prices crossed the KS => It may lead to a major trend change
Moving average - Kijun sen MM26
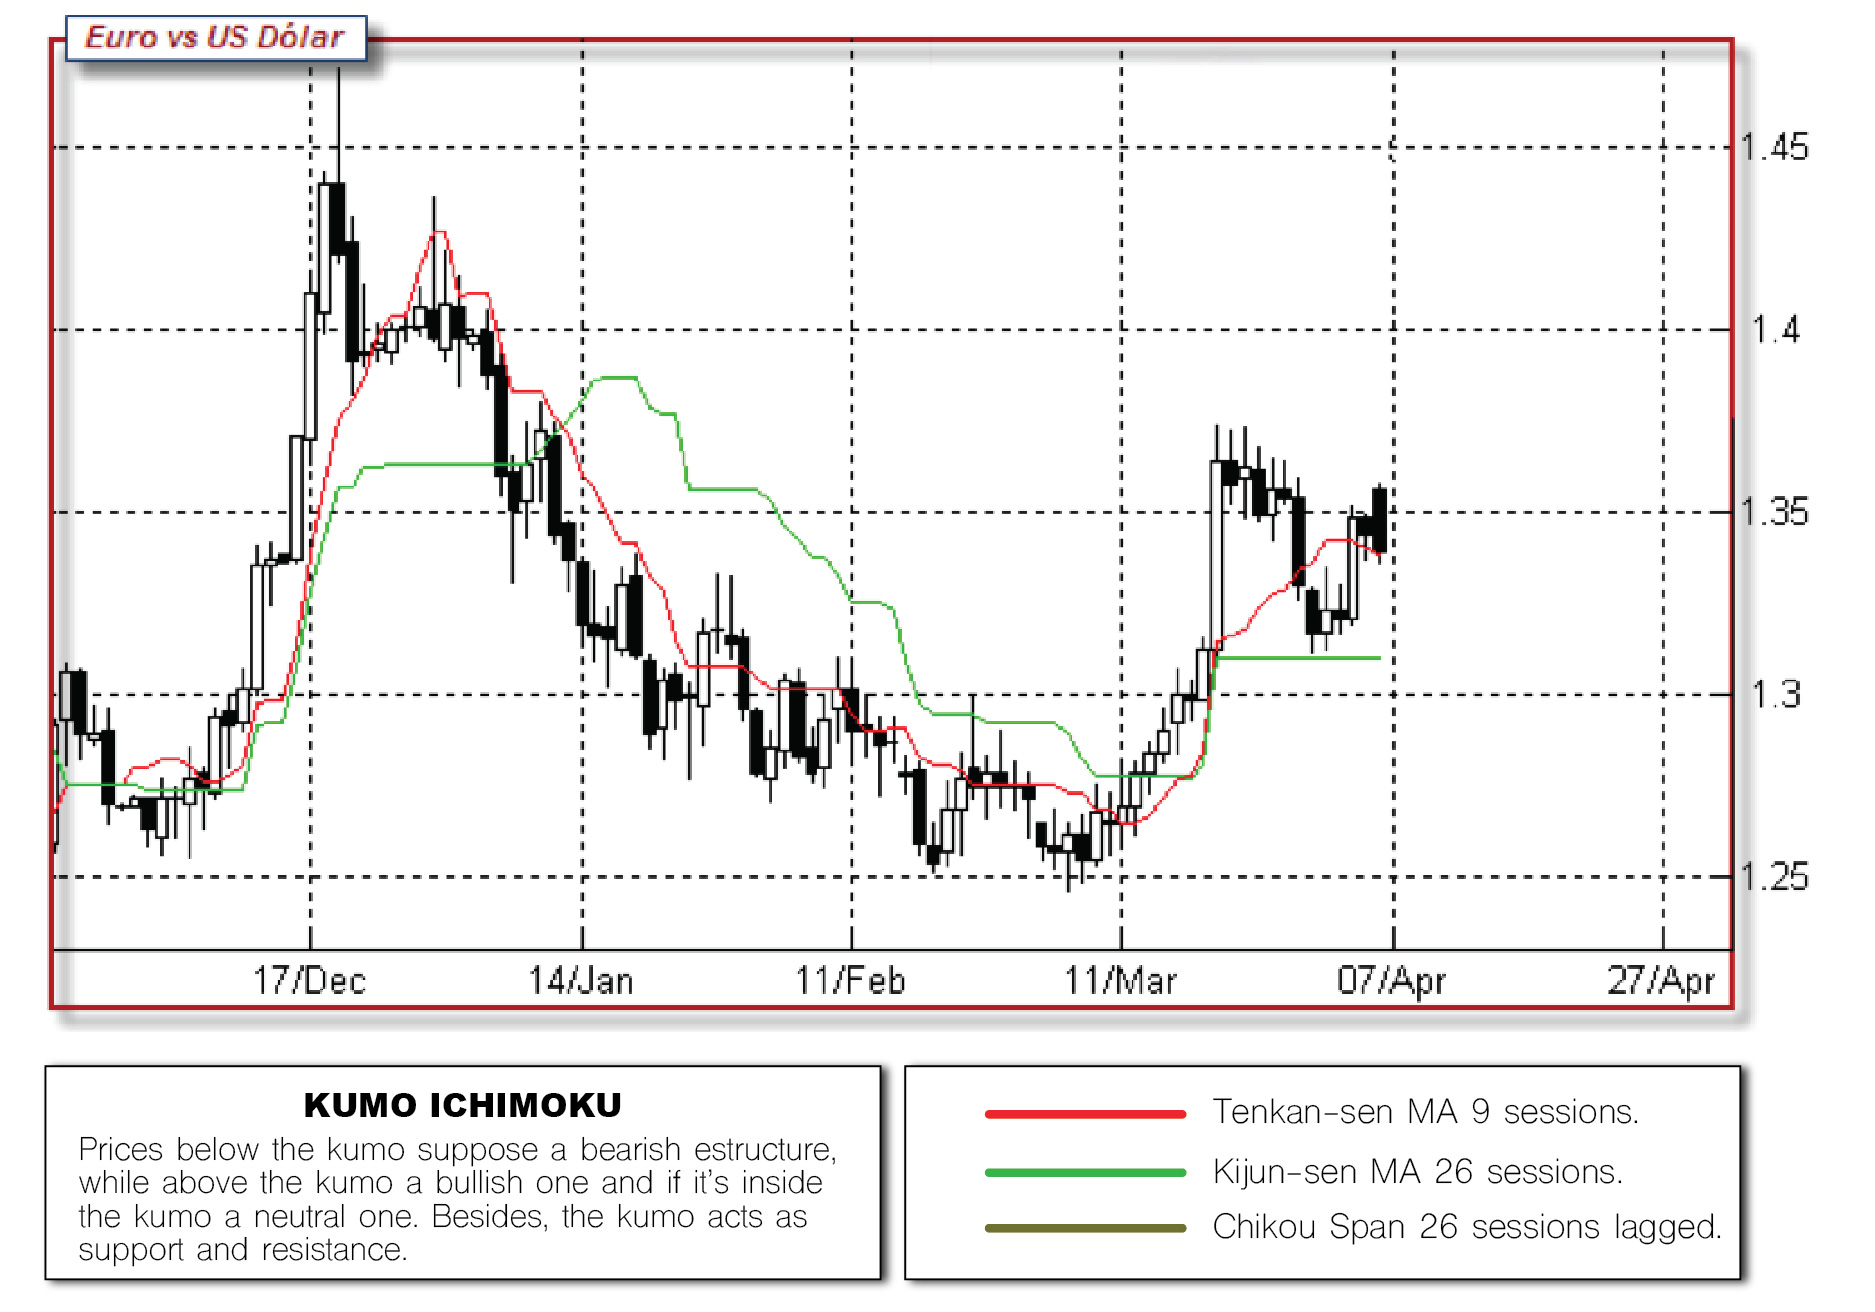
CALCULATION
(26 days’ high + 26 days’ low)/2TREND
The short term trend is in the direction that the KS 26 is pointing. The step reflects the underlaying strength. A flat KS means consolidation.
SENTIMENT
If Price > KS Bullish médium term bias
If Price < KS Bearish médium term bias
POSIBLE SIGNALS
A major change signal may be considered If the price crosses the KS in the opposite way than the trend.
From this point we will consider a trend change.
Moving averages cross
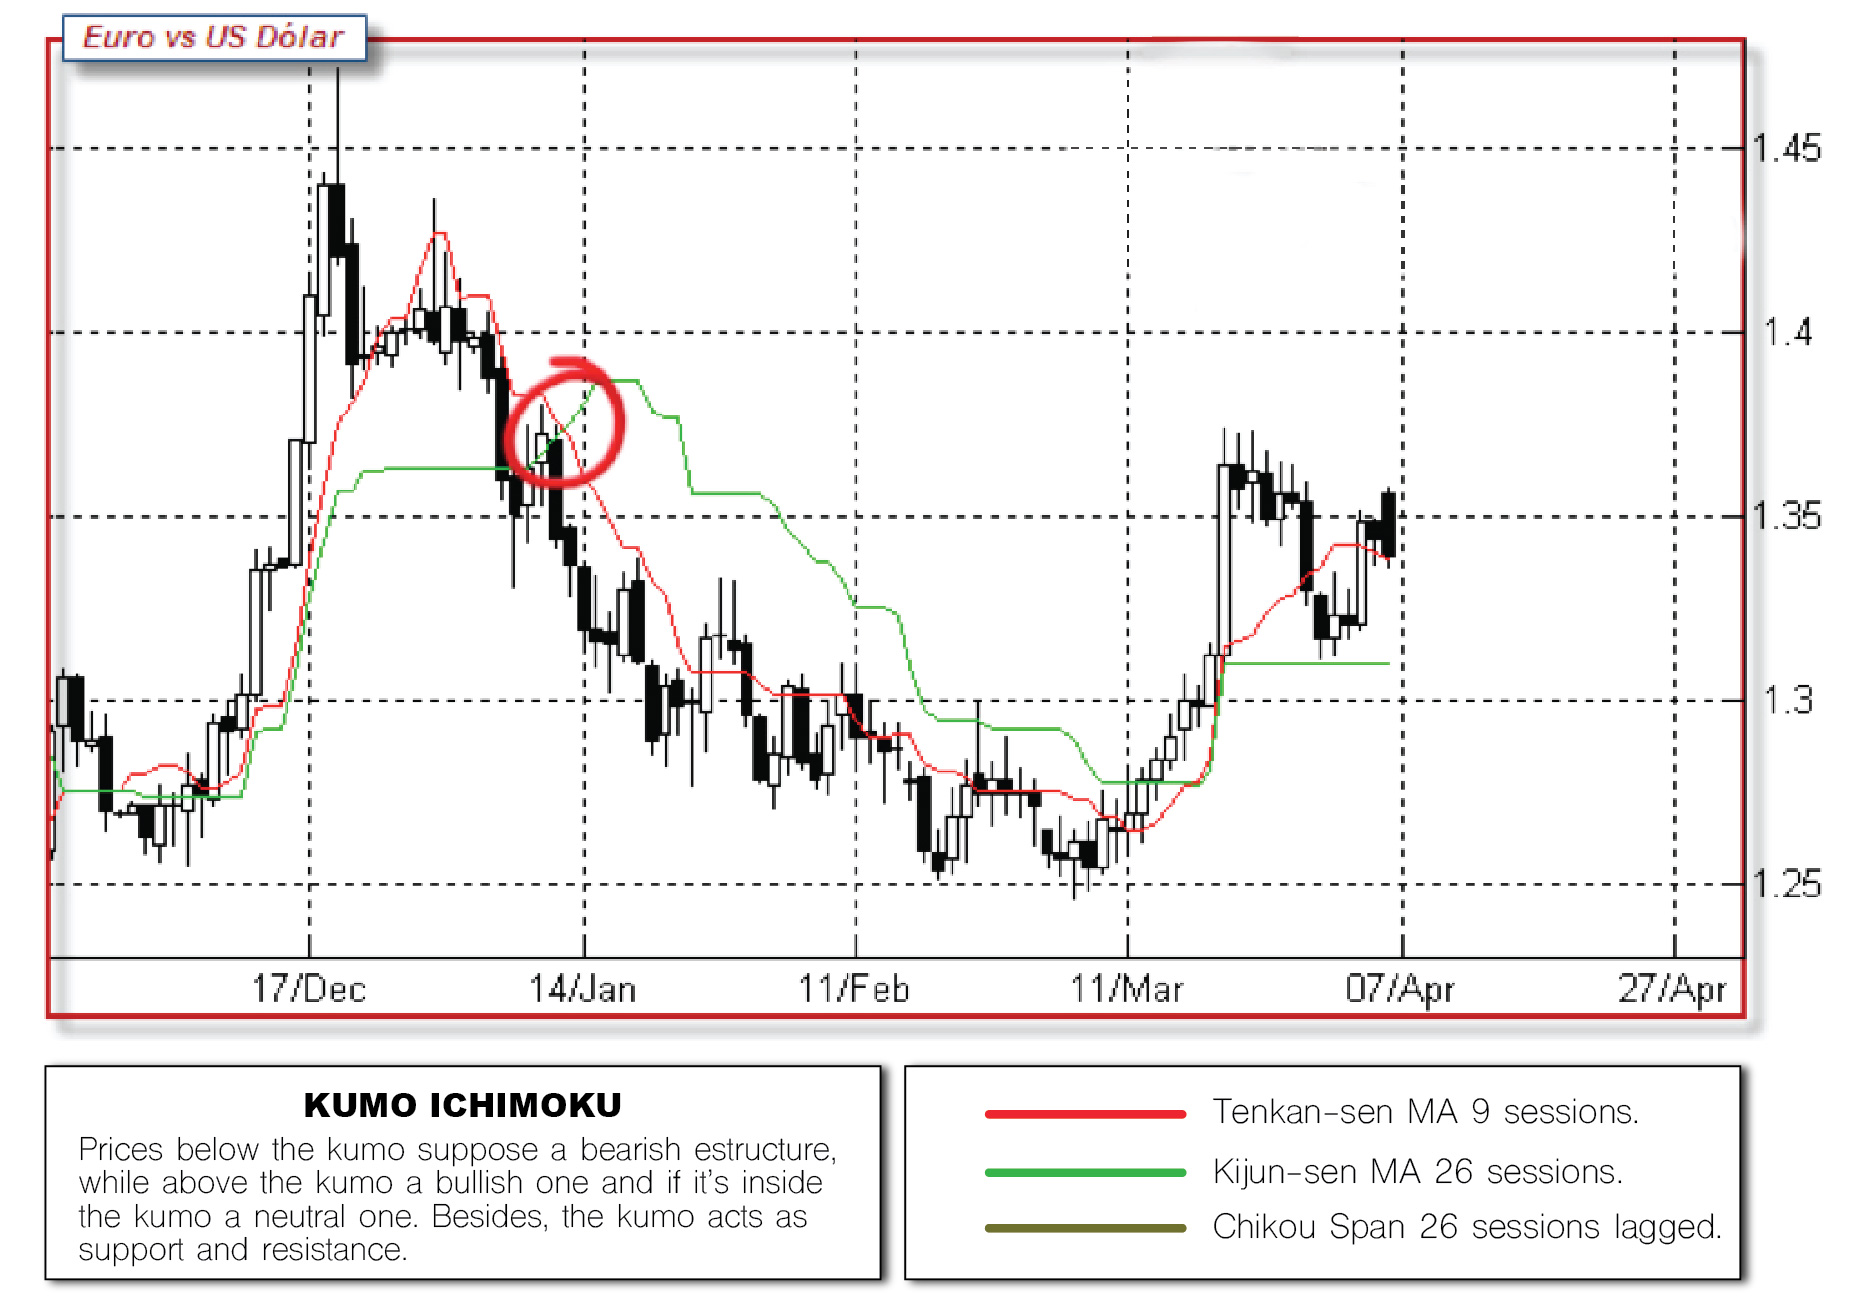
Tenkan Sen vs Kijun Sen bearish cross.
Ichimoku use of moving averages is similar to western techniques. When the fast moving average TS 9 crosses downwards the slower KS 26, it generates a selling signal.
Bullish cross of the Tenkan Sen vs Kijun Sen
When the fast moving average TS 9 crosses the slow KS 26 upwards, it generates a sell signal
Chikou Span – Shifted back 26
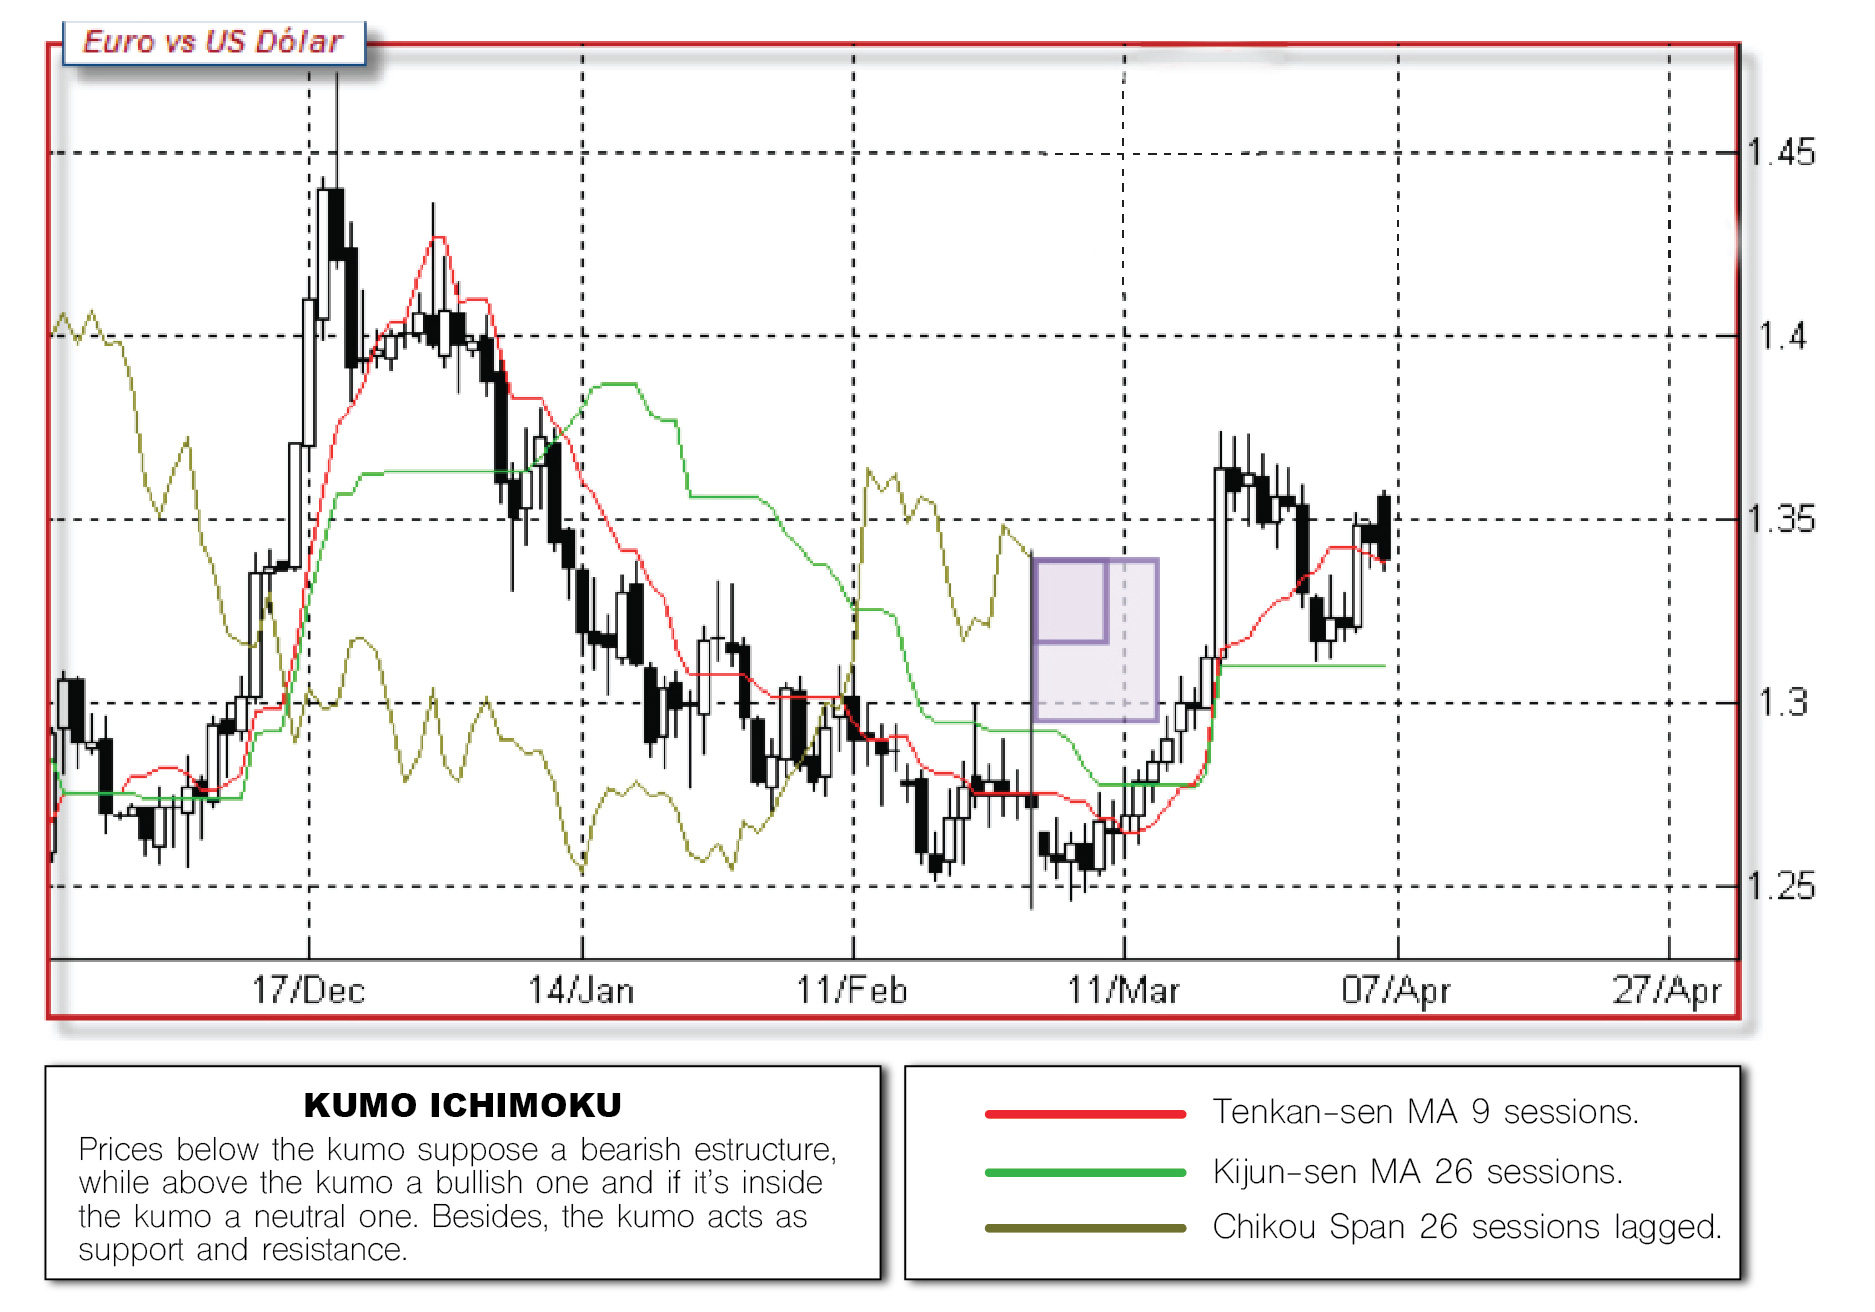
CALCULATION
Closing Price shifted back 26 days.
SENTIMENT
If Chikou > Price Bullish bias
If Chikou < Price Bearish bias
If Chikou is close to the price, neutral bias
Not only the price, but the other lines afects, pushing up or down the chikou, and therefore, the prices, acting as supports and resistances.
POSIBLE SIGNALS
Look for the upcoming days and a minor move (5%-10% in the equity market).
If the Chikou line is in an open path, it’s positive. Then potential trend has no resistances.
If the Chikou is hitting (in the box) the price, it’s a negative signal.
This also applies, in a lower extent, to the support or resistance when the chikou touches the kumo.
The cloud lines
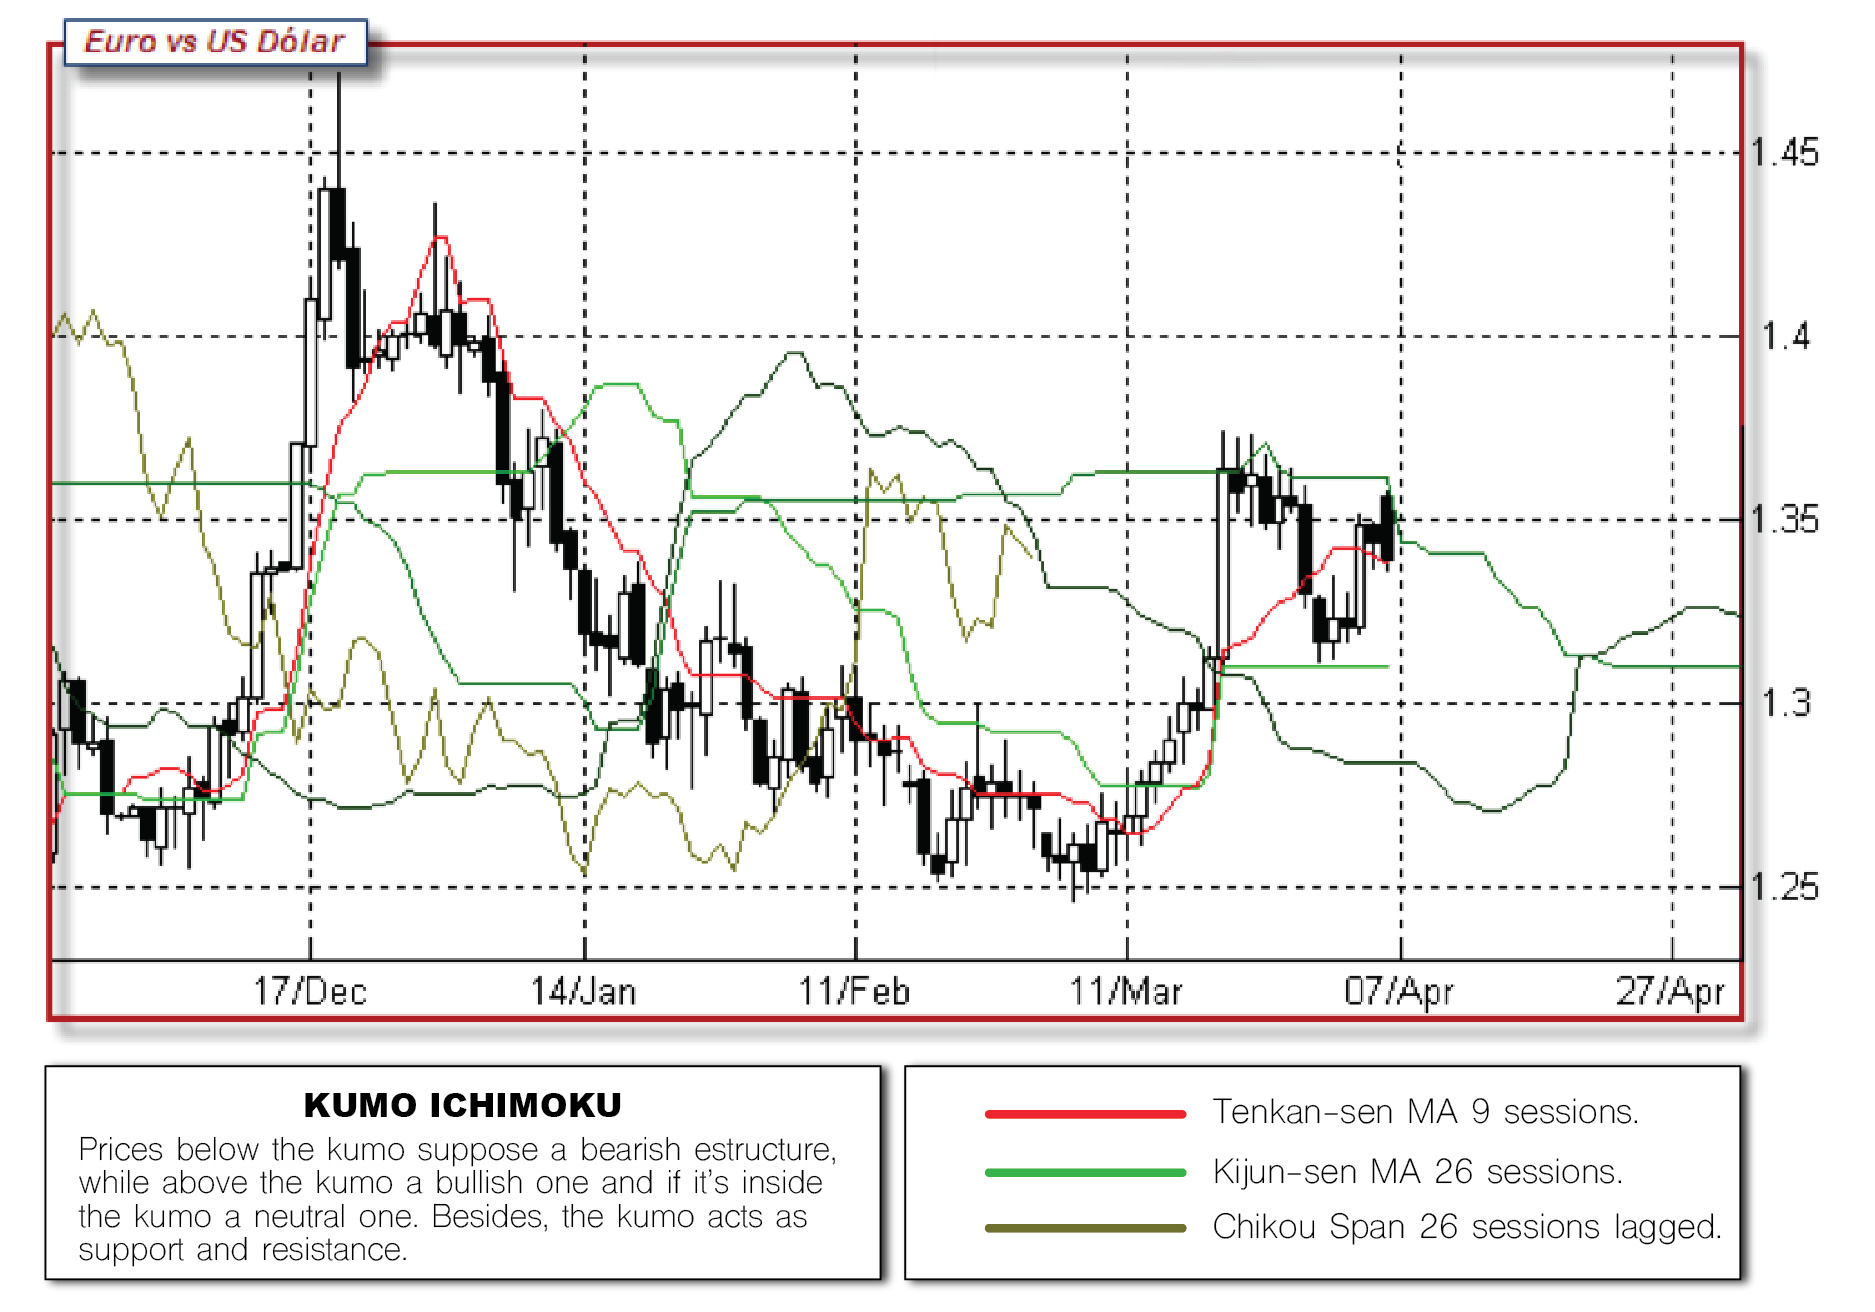
Senkou Span A + Senkou Span B = KUMO / CLOUD / NUBE
SENKOU SPAN A
(Tenkan Sen + Kijun Sen)/2SENKOU SPAN B
(52 days’ high + 52 days’ low)/2Both lines are shifted forward 26 days.
The area between both lines (kumo) is colored to highlight them.
The specific color is not relevant.
The Kumo acts as a support or resistances level. The more thickness the kumo is, the stronger effect as a support or resistance.
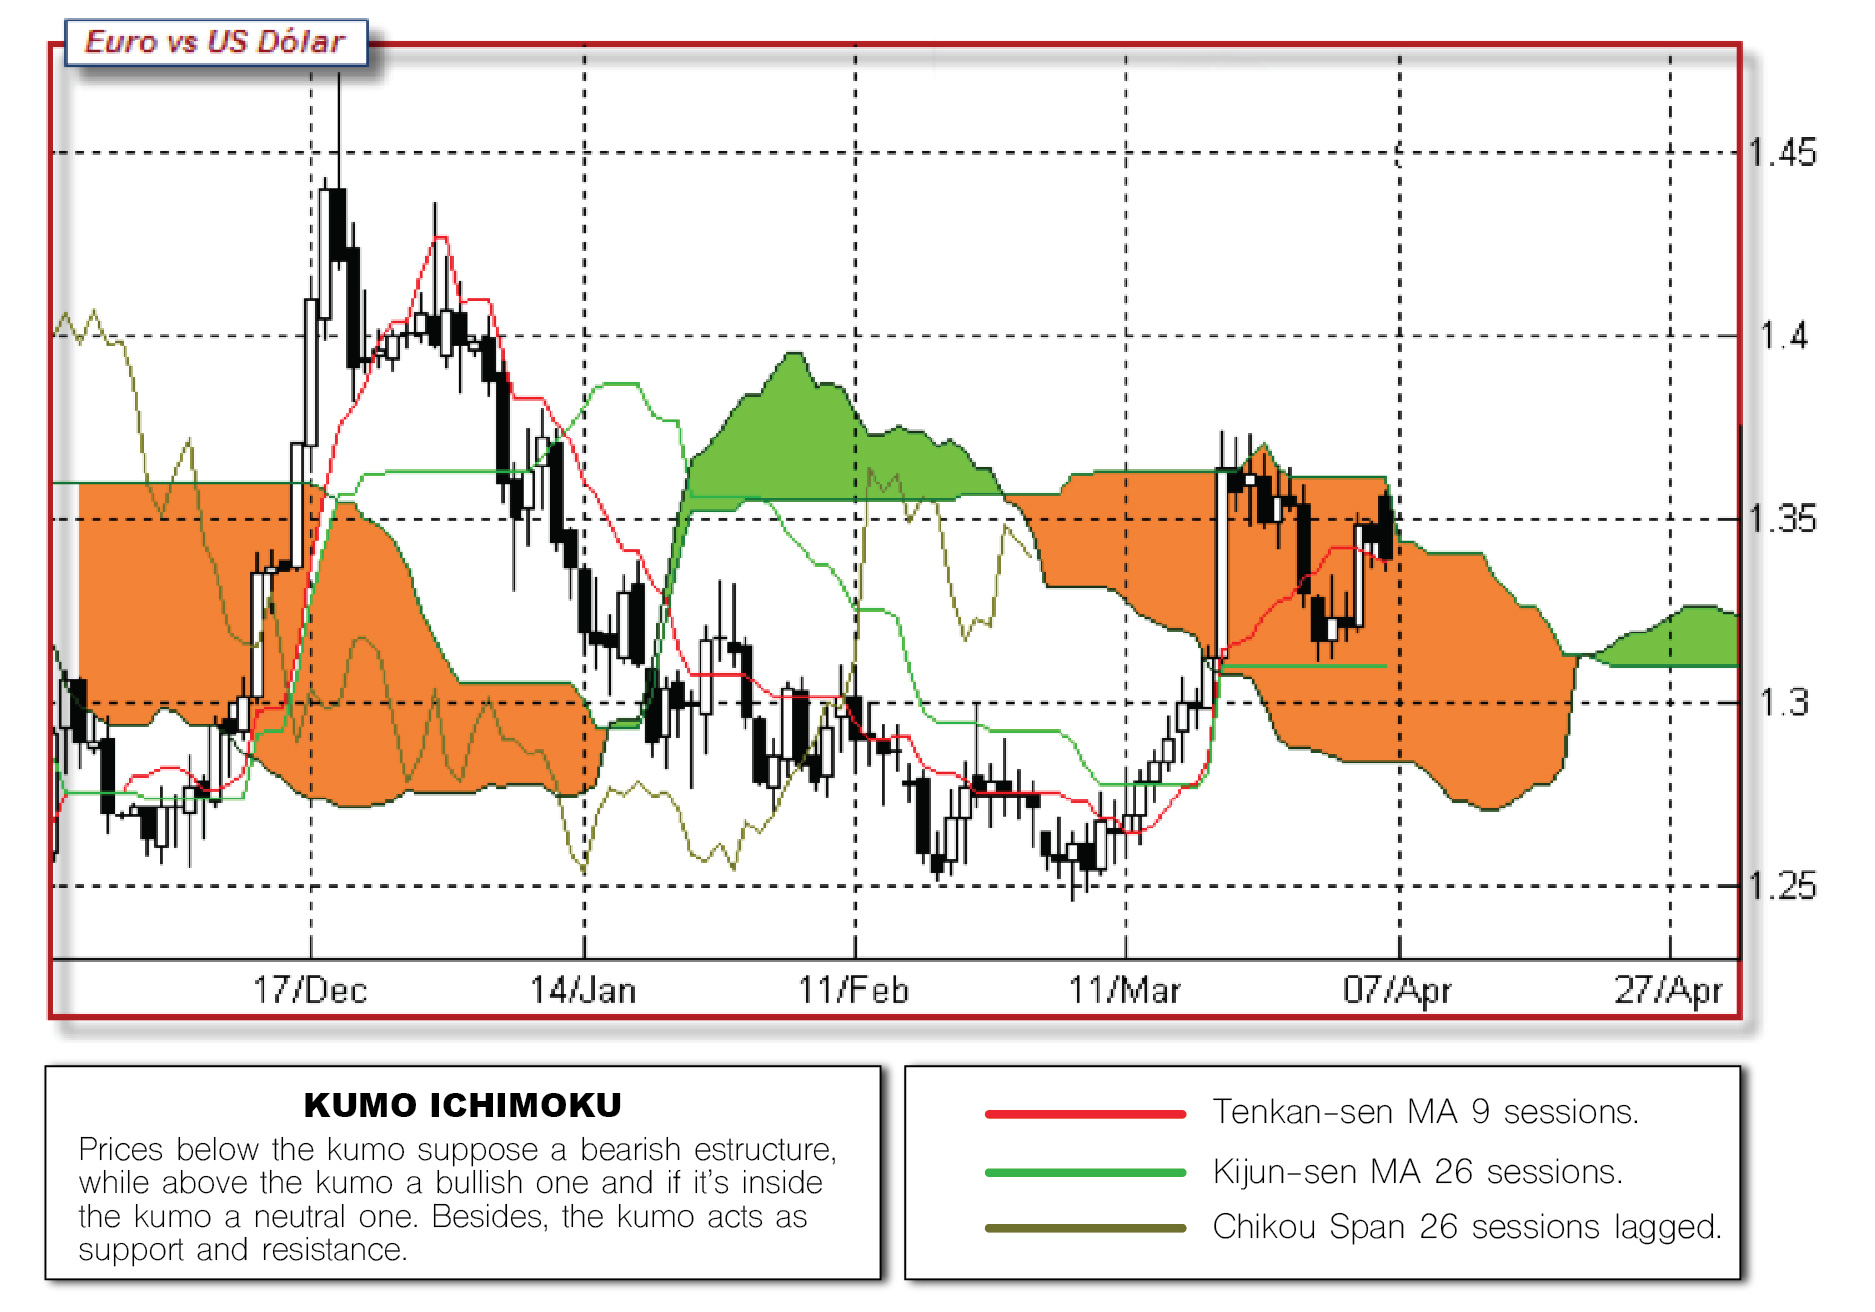
TREND
The kumo can be Split into 2 main phases: the current kumo and the future kumo.
The current kumo shows the current trend. Future kumo shows levels and expectations.
SENTIMENT
If Price > Kumo Bullish bias
If Price > Kumo Bearish bias
If Price = kumo Neutral bias
POSIBLE SIGNALS
When the price crosses upwards the kumo a bullish signal come’s up (watch out for potential noises).
When the prices crosses down the kumo, a bearish signal is shown.
When the price enters the kumo that’s a neutral signal.
Analysis
- The price is just in the kumo after a consolidative phase. It’s a critical resistance moment.
- Price is above both the TS and the KS: Bullish short term trend.
- TS 9 > KS 26: Short term bullish.
- TS is pointing downwards and KS is flat.
- Chikou, open path vs price. But it’s not open vs kumo. The resistance should be broken, that is, the highs (between 11/Mar and 7/Apr).
- Distance to the closer major resistance: enough.
- Future Kumo: Bearish – first half.
Neutral – second half. - Buying entry level: close to the TS 9 and not far away from KS 26. KS 26 as a stop loss level.
Price vs current kumo
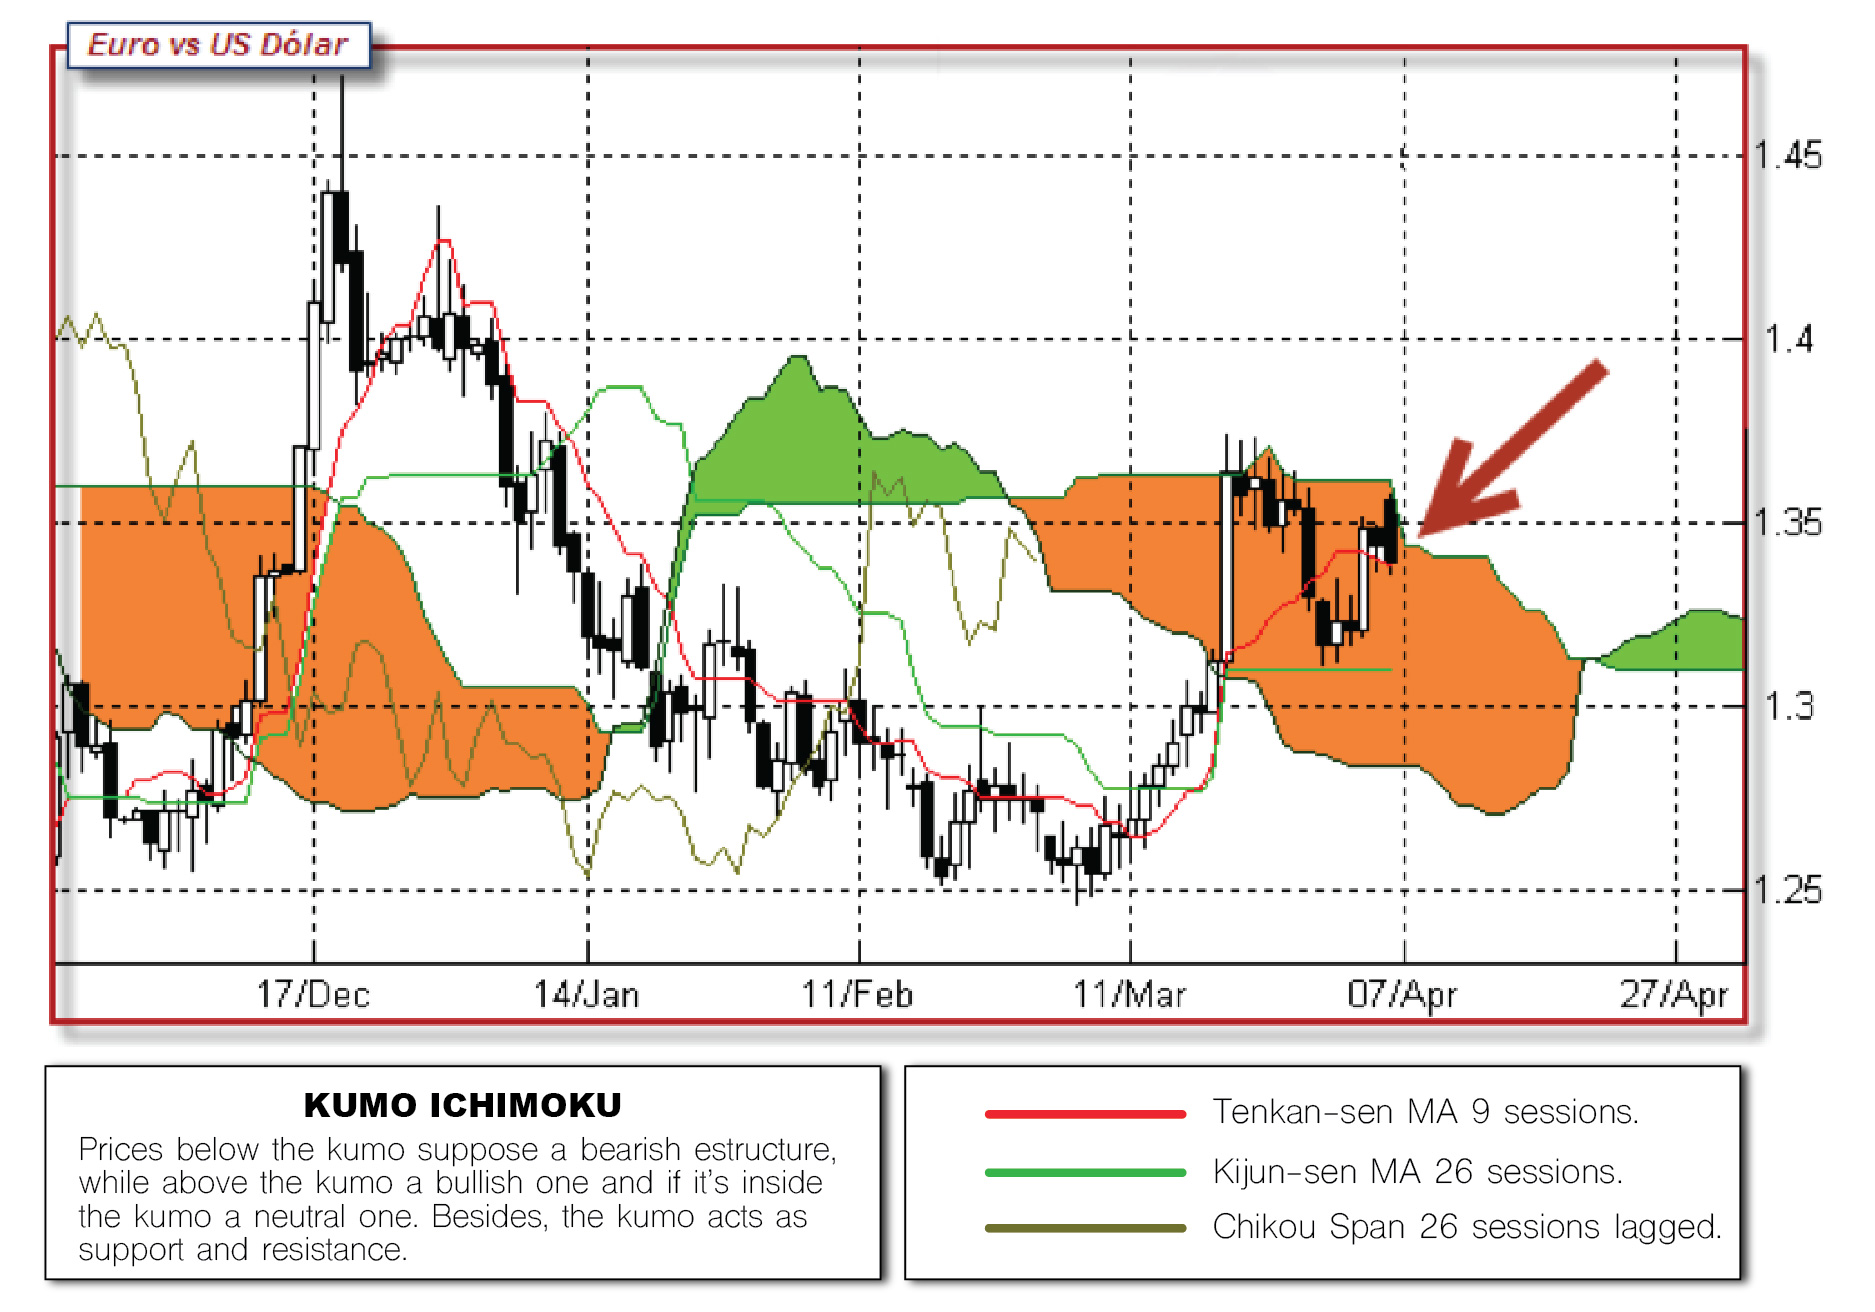
The price is just in the kumo after a consolidative phase. It’s a critical resistance moment.
As the recent behavior shows, the kumo is working well.
The kumo is thick, relevant.
Tenkan Sen 9 and Kijun Sen 26

TS 9 > KS 26: Short term bullish.
Price is above both the TS and the KS: Bullish short term trend.
But in the shortest terms, TS is pointing downwards and KS is flat.
Entries: current level close to the TS 9 and relatively close to the KS, although some far away from it. The KS may be used as a stop loss level.
Chikou
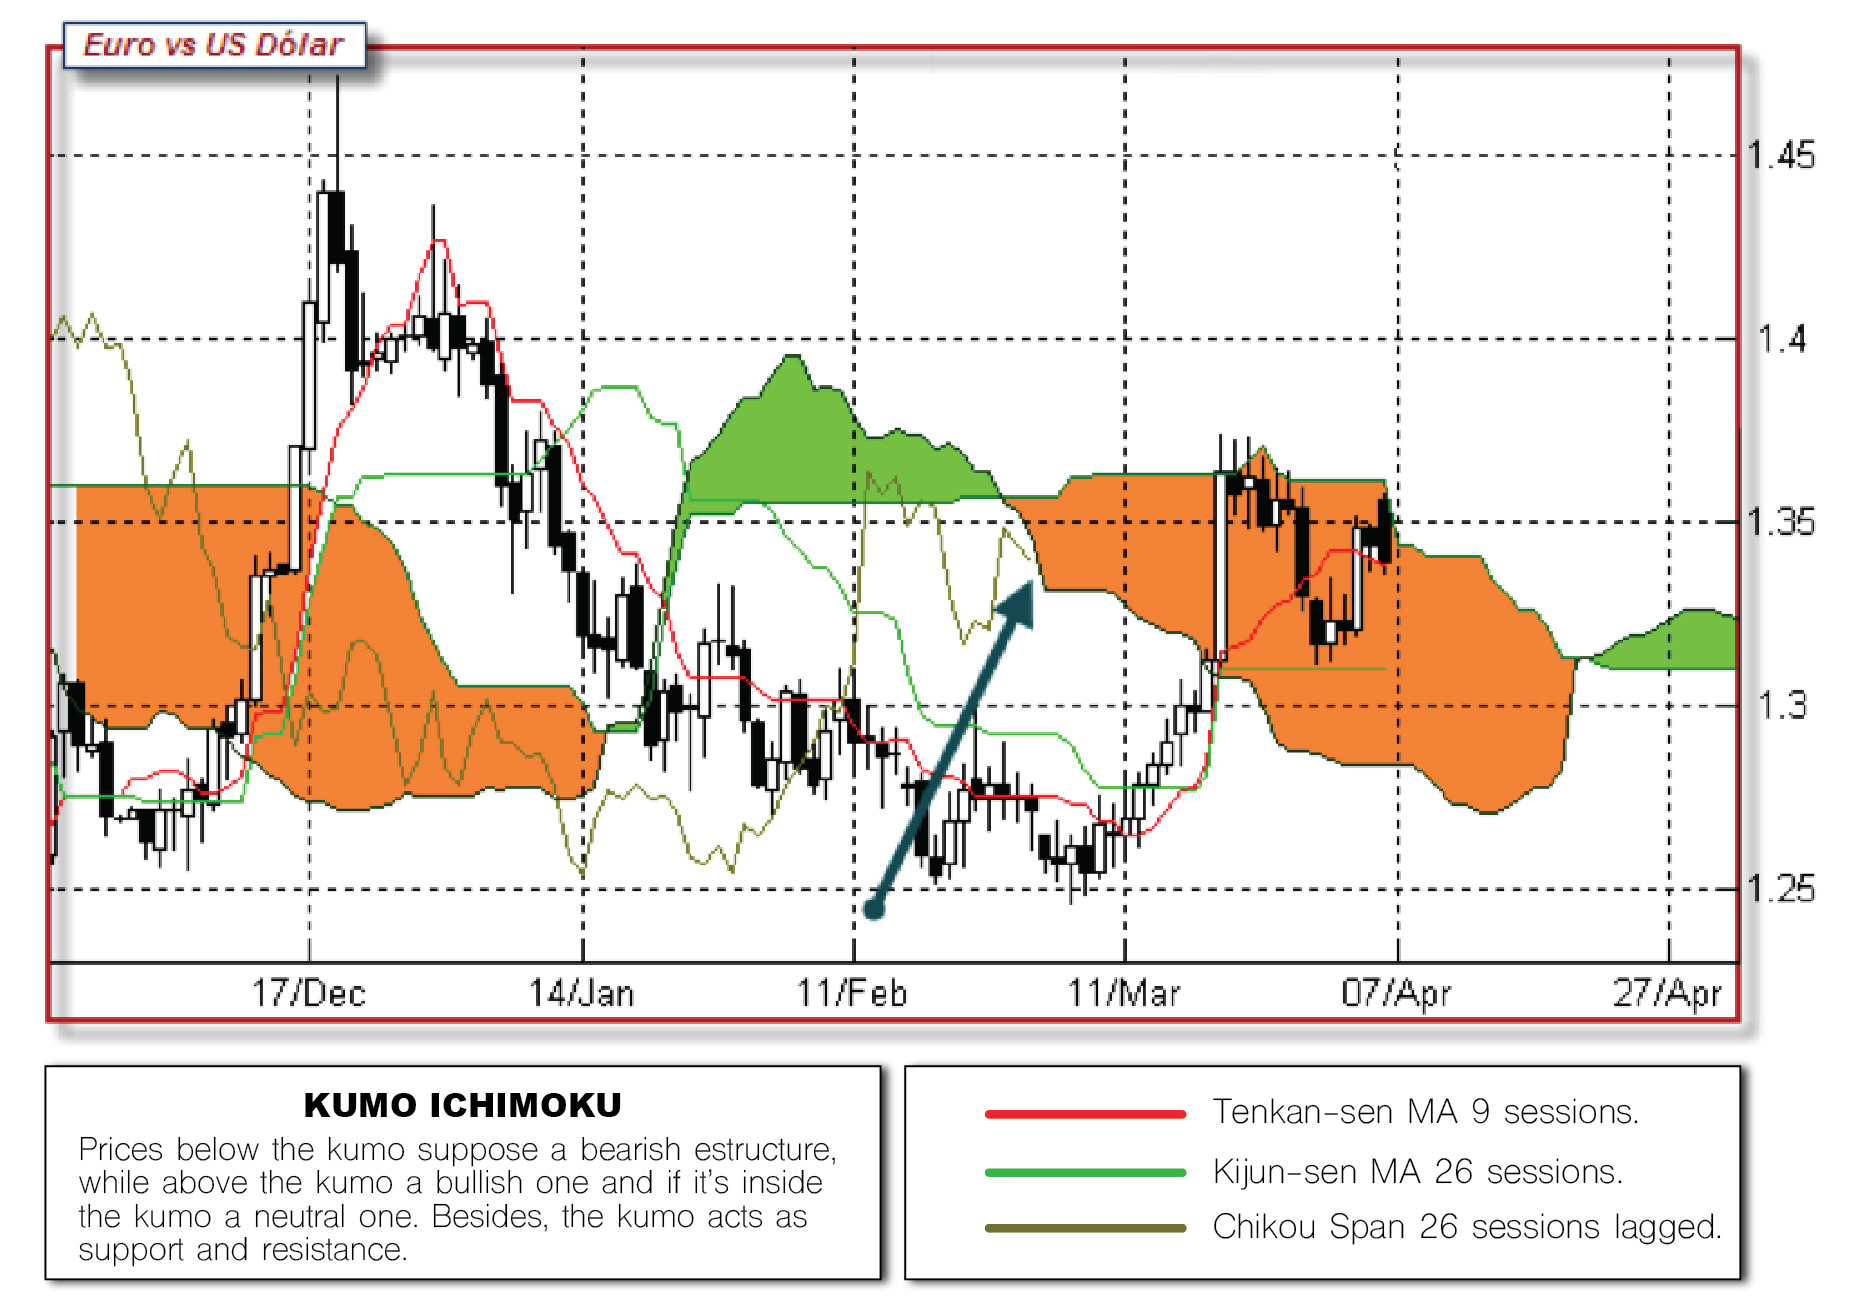
Chikou, open path vs the price.
But it’s not open vs kumo. The resistance should be broken, that is, the highs (between 11/Mar and 7/Apr).
Distance to the closer major resistance
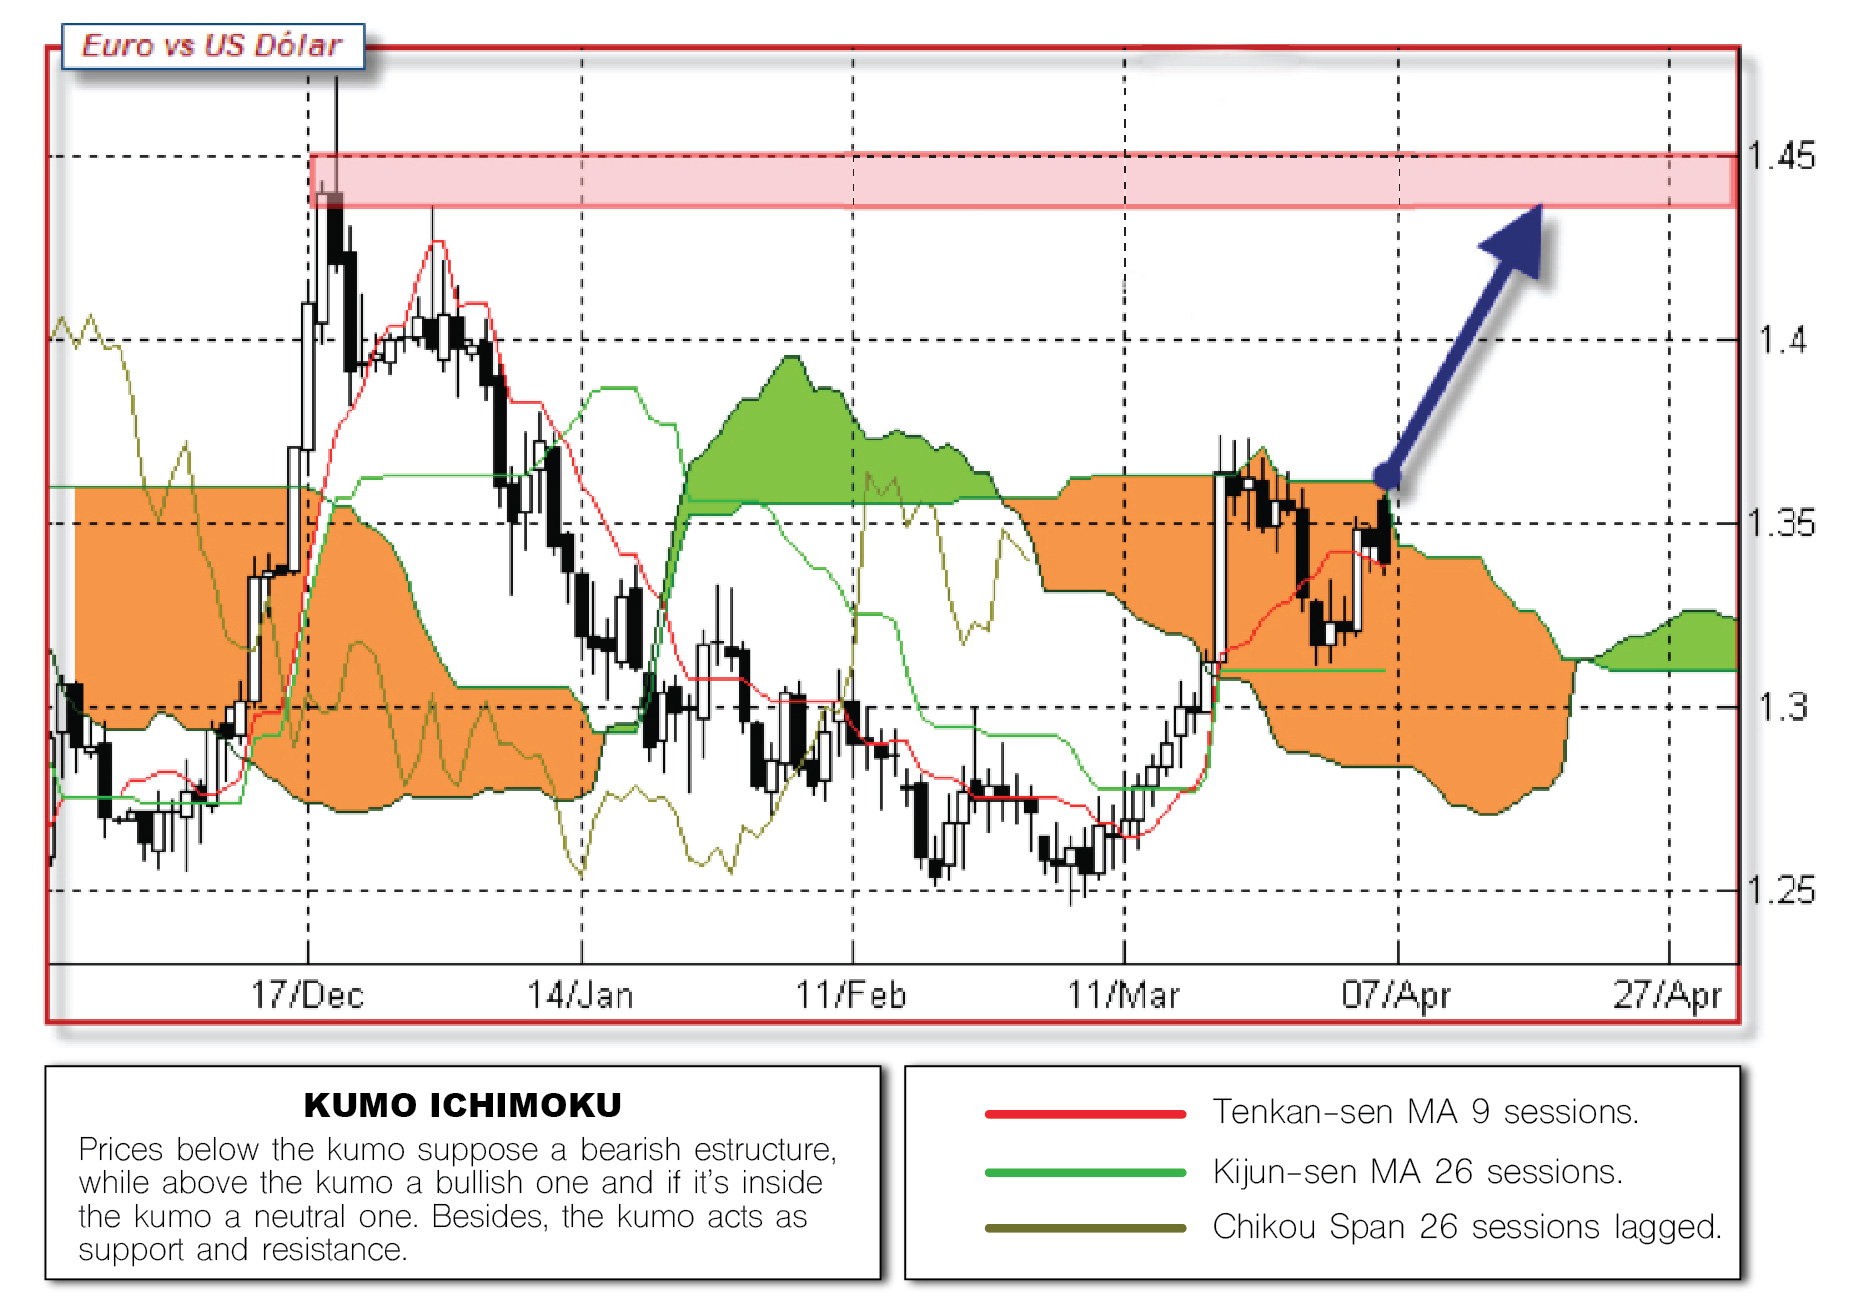
Enough way to take advantage of trend.
It may be seen in the blue arrow.
Future kumo
Bearish – first half.
Neutral – second half.